Le retour sur investissement du mécénat de compétences : comment tout mesurer

Tous les responsables RSE connaissent ce moment. Vous arrivez à une réunion budgétaire avec un programme auquel vous croyez, et la direction vous demande le retour sur investissement précis de votre mécénat de compétences. Dans ces situations, les indicateurs classiques comme le nombre total d'heures enregistrées ou les photos d'une journée de bénévolat ne suffisent généralement pas. Les dirigeants veulent des données concrètes.
Aligner les initiatives à impact social sur les objectifs financiers de l'entreprise est la marque de fabrique du leadership RSE moderne. Si vous avez eu du mal à quantifier la valeur commerciale de vos initiatives lors de ces revues, vous n'êtes pas seul. La bonne nouvelle est qu'il est tout à fait possible de justifier la pertinence économique du mécénat de compétences en utilisant les cadres d'évaluation appropriés.
Vous pouvez mesurer le retour sur investissement du mécénat de compétences en combinant trois facteurs : la valeur monétaire des gains en matière de rétention et de productivité des employés participants, le taux horaire du marché pour les services professionnels offerts aux partenaires associatifs, et les coûts de formation économisés par votre entreprise en développant des compétences sur un projet réel plutôt qu'en salle de classe. Divisez cette valeur combinée par le coût total de votre programme (temps du personnel, frais de plateforme et heures de bénévolat au coût complet) pour obtenir un ratio.
La plupart des programmes bien gérés se situent entre 2:1 et 5:1. La suite de ce guide vous montre exactement comment construire ce chiffre, le défendre devant un directeur financier et le maintenir de manière cohérente au fil du temps.
Qu'est-ce qui constitue le « retour sur investissement » d'un programme de mécénat de compétences ?
Les responsables RSE posent souvent cette question presque mot pour mot pendant la période budgétaire : qu'est-ce qui compte exactement comme un retour ici ? C'est une question légitime, car le mécénat de compétences se situe à l'intersection du développement des talents, de l'investissement communautaire et de la marque employeur, et chacune de ces fonctions a sa propre vision de ce qu'est une « réussite ».
La réponse honnête est que le retour sur investissement dans ce contexte n'est pas un chiffre unique. Il s'agit d'un ensemble de données qui, ensemble, indiquent à une entreprise si le temps et l'argent investis dans le mécénat de compétences génèrent plus de valeur qu'ils ne coûtent.
Les trois réservoirs de valeur que chaque programme devrait suivre
Tout modèle de mesure crédible du mécénat de compétences s'appuie sur trois réservoirs de valeur distincts :
- Valeur commerciale interne : Suit la rétention, l'engagement des employés et les gains de productivité parmi les participants qui font du bénévolat.
- Valeur communautaire externe : Mesure la valeur monétaire concrète, au prix du marché, des services professionnels reçus par un partenaire associatif.
- Valeur de développement : Quantifie les compétences techniques et de leadership que les employés acquièrent sur un projet réel, qui nécessiteraient autrement un budget de formation interne formel.
Les programmes qui ne rendent compte que de l'un de ces trois réservoirs ont tendance à sous-estimer leur propre valeur. Une équipe financière qui fait du bénévolat pour aider une association à reconstruire son modèle budgétaire, par exemple, génère simultanément de la valeur communautaire (un système financier fonctionnel pour l'association), de la valeur de développement (gestion des parties prenantes dans des contraintes réelles) et souvent de la valeur de rétention (un sens accru de la mission lié à l'employeur). Ne rapporter que les heures passées, c'est passer à côté des deux tiers de l'histoire.
Pourquoi le nombre d'heures enregistrées n'est pas un indicateur de départ idéal
Il est facile de comptabiliser des heures, et c'est précisément pour cette raison que tant de programmes s'en contentent. Le problème est qu'une heure enregistrée indique seulement qu'une activité a eu lieu. Elle ne dit rien sur ce qui a changé, que ce soit pour l'association, pour l'employé ou pour l'entreprise.
Rapport 2026 sur le quotient de bénévolat d'entreprise de Goodera, qui a analysé les données de plus de 3 000 entreprises avec des points de référence détaillés issus de 240 organisations publiant des rapports publics, a révélé que les indicateurs basés sur les heures sont largement utilisés dans les rapports ESG précisément parce qu'ils sont simples à agréger entre les régions, et non parce qu'ils reflètent les résultats obtenus.
Ceci nous rappelle que les heures enregistrées, bien qu'étant une mesure importante, constituent le socle d'un cadre d'évaluation, et non son aboutissement. Une analogie utile : les heures enregistrées sont comme les impressions dans une campagne marketing. Elles comptent, mais personne ne mesurerait le succès d'un budget marketing uniquement en impressions pour en définir le retour sur investissement.
Établir votre base de coûts avant tout calcul
Il est impossible de calculer un ratio sans un dénominateur honnête. La plupart des programmes sous-estiment largement leurs coûts réels, ce qui gonfle artificiellement le chiffre de retour sur investissement présenté in fine. Établir une base de coûts précise avant d'effectuer le moindre calcul de bénéfice permet de garantir la crédibilité du chiffre final lorsqu'il arrive sur le bureau d'un directeur financier.
- Coûts directs du programme
Commencez par les coûts qui apparaissent sur une facture ou une ligne budgétaire. Cela inclut les salaires du personnel gérant le programme, les frais de licence de plateforme ou de logiciel, les paiements aux intermédiaires ou facilitateurs de bénévolat, ainsi que le coût complet du temps de bénévolat lui-même (salaire plus avantages sociaux, au prorata des heures effectuées).
Une règle pratique : si votre organisation rémunère un prestataire pour gérer la mise en relation, la logistique et le reporting, ces frais doivent être entièrement intégrés à la base de coûts, même s'ils semblent relever des dépenses opérationnelles plutôt que du « programme ». Les ignorer parce qu'ils sont facturés via un centre de coûts différent est l'un des moyens les plus rapides de surestimer accidentellement le retour sur investissement.
- Les coûts cachés que votre équipe RSE pourrait oublier
Au-delà des postes de dépenses évidents, il existe des coûts qui finissent rarement dans un tableur. Le temps d'intégration des associations, c'est-à-dire les heures que votre équipe passe à briefer une organisation partenaire sur le périmètre et les attentes, représente un travail réel qui soutient l'engagement. La définition et la redéfinition du périmètre des projets, en particulier pour les missions de mécénat de compétences de longue durée, peuvent absorber des dizaines d'heures de travail avant même qu'un bénévole ne soit affecté.
L'analyse de Goodera sur le bénévolat de compétences par rapport aux programmes de bénévolat traditionnels a révélé que, par heure de bénévolat, les missions de mécénat de compétences coûtent environ trois fois plus cher à administrer que le bénévolat traditionnel, en grande partie à cause de l'infrastructure nécessaire pour le cadrage, la mise en relation et la mesure. Ce n'est pas une raison pour éviter les programmes de mécénat de compétences. C'est une raison pour s'assurer que le volet « coûts » de votre équation reflète cette infrastructure supplémentaire, afin que le chiffre final de retour sur investissement résiste à l'examen.
Comment chiffrer les gains liés à la rétention des employés ?
C'est, presque sans exception, la première question posée lors d'un entretien avec un DRH ou un directeur financier. La rétention est le domaine où le mécénat de compétences présente son argument financier le plus solide, car le turnover est l'un des rares coûts liés au personnel que tout responsable financier suit déjà de près.
Calculer les économies de rétention attribuables
La Society for Human Resource Management estime que le remplacement d'un employé coûte entre 50 et 200 pour cent du salaire annuel de cet employé, une fois pris en compte le recrutement, l'intégration et la perte de productivité. Une étude longitudinale de six ans menée par le Le Boston College Center for Corporate Citizenship a étudié les tendances de la main-d'œuvre en entreprise et a révélé une réduction de 36 % du taux de rotation du personnel spécifiquement chez les employés ayant activement participé à du bénévolat de compétences, par rapport à ceux qui ne l'ont pas fait.
Pour calculer les économies liées à la rétention, multipliez le nombre d'employés participants que vous prévoyez raisonnablement de conserver grâce au programme par votre coût moyen de remplacement par employé. N'oubliez pas qu'un calcul responsable ne doit prendre en compte qu'une partie de l'écart de rétention, et non le pourcentage total, car d'autres facteurs (tels que la rémunération, la qualité du management ou les conditions du marché) jouent toujours un rôle dans la décision d'un collaborateur de rester.
Retour sur investissement de la rétention pour un effectif de 500 personnes
Prenons l'exemple d'une entreprise de 500 employés, avec un salaire moyen de 85 000 $ et 150 employés participant chaque année à du bénévolat de compétences. En utilisant une estimation prudente de 90 % du coût de remplacement (conformément à la fourchette de 50 à 200 % établie par la SHRM) et en n'attribuant au programme que la moitié de l'effet de rétention observé, le calcul est le suivant :
150 participants multipliés par une amélioration estimée de 5 % de la rétention équivaut à environ 7,5 employés supplémentaires conservés par an. Avec un salaire moyen de 85 000 $ et un coût de remplacement prudent de 90 %, cela représente environ 573 750 $ d'économies annuelles sur les coûts de remplacement.
Même un programme avec une participation modeste, géré de manière prudente, génère des économies de rétention qui compensent largement son coût. C'est précisément pour cette raison que la rétention constitue souvent le pilier de l'argumentaire commercial, avant même que la productivité ou l'impact communautaire ne soient pris en compte.
Mesurer la valeur du développement des talents grâce aux engagements basés sur les compétences
Le bénévolat de compétences fait également office d'extension particulièrement efficace et peu coûteuse de la stratégie de formation et de développement d'une entreprise. Ce positionnement est crucial lors de la présentation du programme à un responsable L&D ou Talent, car il présente le bénévolat comme un complément aux investissements de formation existants plutôt que comme une initiative distincte en concurrence pour le même budget.
Comparer les coûts du bénévolat aux dépenses traditionnelles de formation
Un moyen simple de quantifier cette valeur consiste à comparer le coût d'une expérience de bénévolat de compétences à celui d'un programme de formation formel équivalent. Si une formation en leadership coûte 2 500 $ par participant et qu'un projet pro bono d'une rigueur comparable coûte à votre organisation entre 400 $ et 600 $ par participant en frais de gestion, la différence représente une économie réelle et justifiable, à condition que les compétences acquises se recoupent réellement.
Cette comparaison est plus pertinente lorsqu'elle est appliquée à des compétences spécifiques plutôt qu'à des notions vagues de « leadership ». La gestion de projet, la communication avec les parties prenantes et la collaboration interculturelle sont les compétences les plus fréquemment citées dans le cadre d'engagements associatifs, et elles s'intègrent parfaitement aux référentiels de compétences des entreprises.
Quelles compétences sont réellement transférables au poste de travail
L'intégration d'initiatives basées sur les compétences aux côtés du bénévolat classique permet de créer un portefeuille d'impact d'entreprise complet. Selon les recherches de la Taproot Foundation, 95 pour cent des professionnels en entreprise perfectionnent avec succès leurs compétences professionnelles quotidiennes grâce à des missions de bénévolat de compétences.
Cette approche complète les événements de bénévolat d'équipe traditionnels, qui restent essentiels à la culture d'entreprise, permettant aux sociétés de stimuler l'engagement des employés sous plusieurs angles stratégiques simultanément.
Une étude mondiale distincte de l'ESADE Business School a révélé que 92 pour cent des employés ayant fait du bénévolat par l'intermédiaire de leur employeur ont signalé une amélioration de leurs performances professionnelles, selon leur propre évaluation ou celle de leurs managers, avec une amélioration du travail d'équipe pour 87 pour cent des participants et des compétences en communication pour 68 pour cent.
« Lorsque nous pensons aux compétences en communication, aux techniques de présentation et aux autres aptitudes que nous développons, la capacité à comprendre une présentation de niveau exécutif et à la délivrer est un autre ensemble de compétences que ces employés acquièrent. Cela renforce donc ce qu'ils apprennent déjà grâce au projet de bénévolat de compétences. »
- Kenrick Fraser, responsable mondial, Impact communautaire des employés et partenariats chez PayPal, lors du webinaire de Goodera sur le Bénévolat de compétences
Productivité et performance : la mesure que recherche la direction
La rétention répond à la question « avons-nous gardé nos collaborateurs ? ». La productivité répond à la question plus complexe : « les personnes que nous avons gardées sont-elles réellement plus performantes ? ». C'est généralement la mesure qui préoccupe le plus un PDG ou un responsable d'unité commerciale, car elle relie directement le bénévolat au rendement plutôt qu'à la stabilité des effectifs.
Lier les données de participation aux résultats des évaluations de performance
Le moyen le plus simple d'établir ce lien consiste à comparer les scores d'évaluation de performance ou les notes des managers des employés ayant participé à du bénévolat de compétences avec un groupe témoin n'y ayant pas participé, en contrôlant le poste, l'ancienneté et les performances antérieures dans la mesure du possible. Cela ne nécessite pas toute une équipe de science des données. Un simple tableau croisé dynamique croisant les dossiers de participation avec les exportations du système de gestion des performances peut révéler une tendance dès le premier cycle d'évaluation.
Une enquête menée par Common Impact a révélé que 96 pour cent des employés bénévoles considèrent explicitement le bénévolat de compétences comme une opportunité de développement professionnel à haute valeur ajoutée. En articulant ces initiatives autour de l'acquisition de compétences, les équipes chargées de l'impact social peuvent combler directement le fossé entre les objectifs d'apprentissage de l'entreprise, l'amélioration des performances et les besoins concrets des communautés locales.
Gains de collaboration au niveau de l'équipe grâce aux projets transversaux
Les projets basés sur les compétences réunissent fréquemment des employés de différents départements autour d'une même mission pour une association, ce qui crée un laboratoire naturel pour mesurer la collaboration interfonctionnelle. Suivre si les participants déclarent avoir de meilleures relations de travail avec des collègues extérieurs à leur équipe immédiate, via une courte enquête post-projet, vous donne un indicateur de la cohésion organisationnelle autrement difficile à quantifier.
Une enquête Deloitte de professionnels en entreprise, menée par le bureau Purpose and DEI de l'entreprise en avril 2024, a révélé que 52 % des participants aux programmes de bénévolat ont fait état d'un moral et d'un esprit d'équipe nettement meilleurs, et que 49 % ont exprimé une fierté accrue envers leur employeur. Dana O'Donovan, qui dirige les activités d'impact social et le Monitor Institute chez Deloitte, a souligné que « le travail représente bien plus que la simple tâche à accomplir » pour les employés en quête de liens à travers un engagement communautaire partagé.
Le retour sur investissement du bénévolat de compétences diffère-t-il de celui du bénévolat traditionnel ?
Oui, tant par son ampleur que par sa nature, bien que les deux approches soient complémentaires plutôt que concurrentes. Le bénévolat traditionnel (par exemple, le nettoyage de parcs, la préparation de repas ou les journées de mentorat) génère une valeur facile à standardiser : heures consacrées, bénéficiaires aidés et valeur marchande estimée du temps donné. Ces chiffres sont simples à agréger à l'échelle d'un effectif mondial, ce qui explique précisément pourquoi ils dominent la plupart des rapports ESG.
Le bénévolat de compétences génère un volume d'heures plus faible, mais une valeur par heure bien plus élevée, car le service rendu reflète une expertise professionnelle plutôt qu'une main-d'œuvre générale.
L'Independent Sector et le Do Good Institute établissent la référence nationale pour le temps de bénévolat à 36,14 $ de l'heure, offrant une alternative crédible et indépendante aux indicateurs de bénévolat traditionnels. Pour mieux refléter la véritable valeur économique des initiatives pro bono spécialisées, les modèles d'évaluation des entreprises devraient adopter les salaires par profession du Bureau of Labor Statistics (BLS).
La leçon pratique pour la plupart des responsables RSE n'est pas de choisir un modèle plutôt qu'un autre, mais de mesurer chacun selon les critères adaptés à son objectif : la portée et la régularité pour le bénévolat traditionnel, la densité de valeur et le transfert de compétences pour le bénévolat de compétences.
Le volet associatif : renforcement des capacités plutôt qu'heures enregistrées
Une vision complète du retour sur investissement prend en compte la valeur créée à l'extérieur de l'entreprise ainsi que celle générée en interne. Dans de nombreux cas, les associations bénéficiant d'un soutien bénévole qualifié constatent une amélioration mesurable de leur capacité opérationnelle, et cette amélioration doit figurer dans un calcul global du retour sur investissement.
Mesurer l'augmentation de la capacité organisationnelle
Une étude de Common Impact a révélé que 85 % des associations ayant reçu un soutien bénévole qualifié ont fait état d'augmentations mesurables de leur capacité organisationnelle et de leur efficacité à long terme. Dans ce contexte, la capacité désigne généralement quelque chose de concret : un modèle financier fonctionnel, une stratégie marketing documentée, un processus d'accueil des bénévoles repensé ou un système technologique qui ne dépend plus de solutions manuelles de contournement.
La méthode la plus efficace pour suivre cet impact est une simple évaluation des capacités avant et après la mission, remplie par l'association partenaire avant le début de l'engagement, puis trois à six mois après sa conclusion. Même une courte enquête de cinq questions portant sur l'efficacité opérationnelle, le temps gagné par le personnel et la confiance dans les livrables vous fournit une donnée défendable, issue directement de l'association, pour votre rapport.
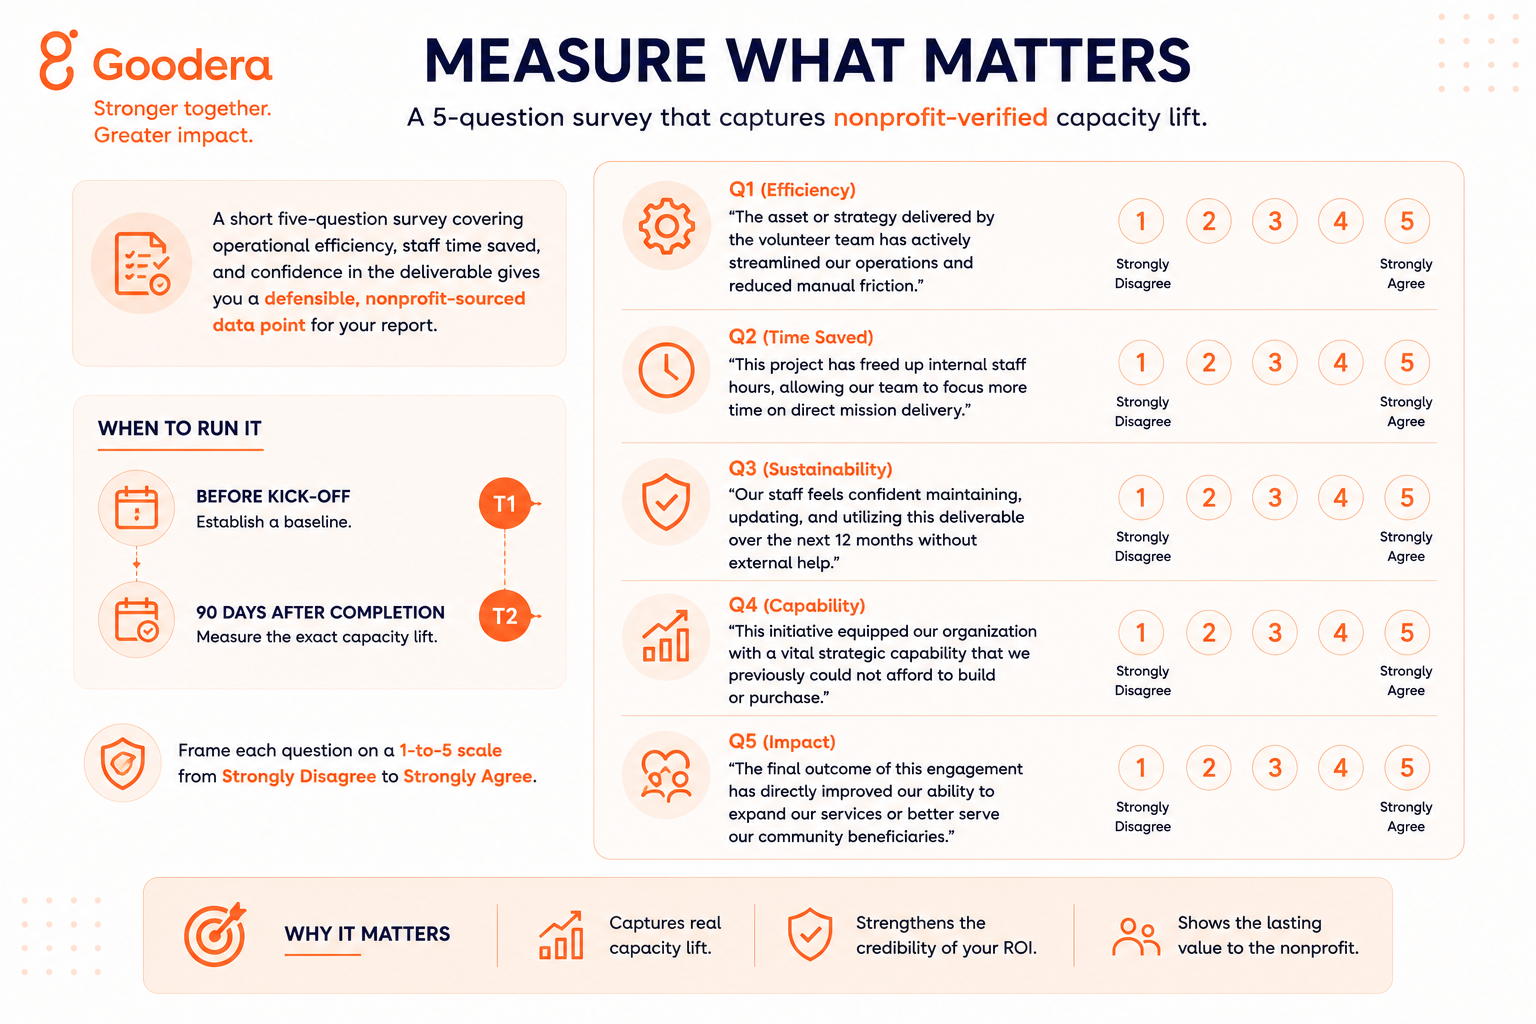
Réalisez cette enquête juste avant le lancement du projet, puis 90 jours après son achèvement pour mesurer précisément le gain de capacité. Utilisez une échelle standard de 1 à 5 (de Pas du tout d'accord à Tout à fait d'accord) :
- Q1 (Efficacité) : « L'actif ou la stratégie fourni(e) par l'équipe de bénévoles a activement rationalisé nos opérations et réduit les tâches manuelles fastidieuses. »
- Q2 (Gain de temps) : « Ce projet a libéré des heures de travail en interne, permettant à notre équipe de se concentrer davantage sur la réalisation directe de notre mission. »
- Q3 (Durabilité) : « Notre personnel se sent capable de maintenir, mettre à jour et utiliser ce livrable au cours des 12 prochains mois sans aide extérieure. »
- Q4 (Capacité) : « Cette initiative a doté notre organisation d'une capacité stratégique essentielle que nous n'avions auparavant pas les moyens de développer ou d'acquérir. »
- Q5 (Impact) : « Le résultat final de cet engagement a directement amélioré notre capacité à étendre nos services ou à mieux servir les bénéficiaires de notre communauté. »
Pourquoi la qualité du livrable doit primer sur le nombre de participants
Il est tentant d'afficher « 50 employés ont fait du bénévolat auprès de 12 associations » comme statistique phare, et il n'y a rien de mal à l'inclure. Mais le nombre de participants ne dit pas grand-chose sur l'utilité réelle du travail produit. Une mesure plus pertinente consiste à demander directement aux partenaires associatifs s'ils ont mis en œuvre la recommandation ou le livrable, et si c'est le cas, s'ils l'utilisent toujours activement.
Assembler la formule complète
Une fois définies les valeurs liées au coût, à la rétention, au développement des talents, à la productivité et à la capacité des associations, les éléments peuvent désormais être combinés en un ratio unique et présentable.
Le calcul du ROI mixte
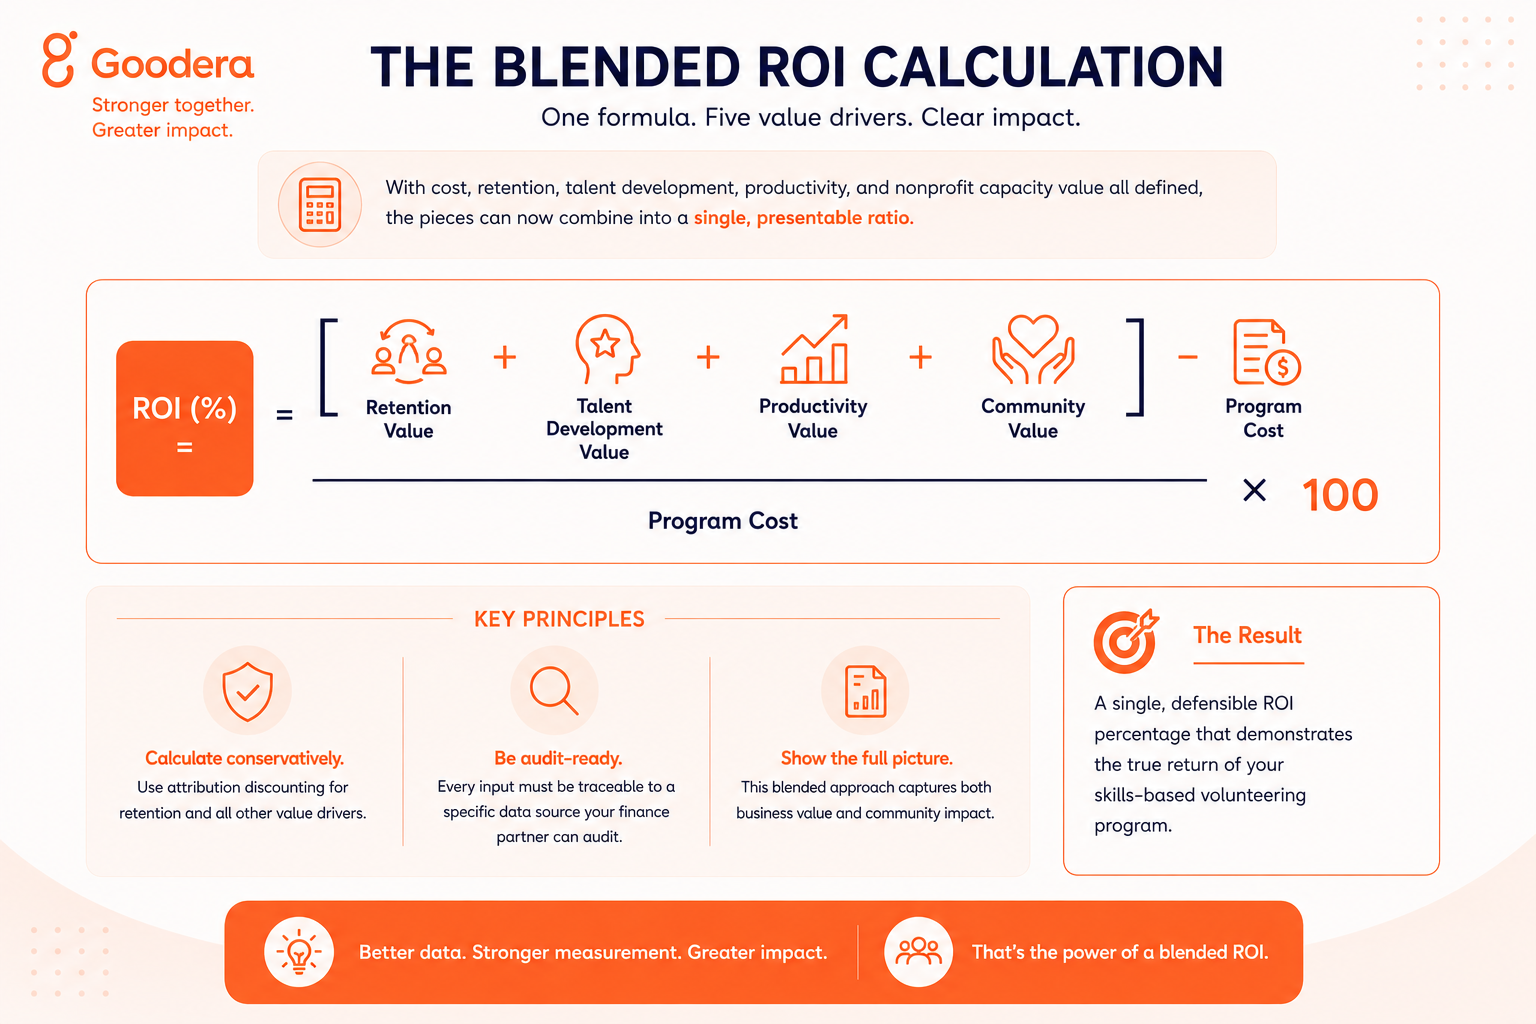
La formule en elle-même est simple, même si les données nécessaires ont demandé un réel travail de préparation :
ROI (%) = [(Valeur de rétention + Valeur de développement des talents + Valeur de productivité + Valeur communautaire) − Coût du programme] ÷ Coût du programme × 100
Chaque composante du numérateur doit être calculée de manière prudente, en utilisant l'actualisation par attribution décrite précédemment dans la section sur la rétention, et chaque donnée doit pouvoir être retracée jusqu'à une source spécifique que votre partenaire financier pourra auditer si nécessaire.
Exemple complet, de l'apport aux résultats
Données du programme
Une entreprise de taille moyenne gère un programme de bénévolat basé sur les compétences impliquant 150 employés sur une année, avec un salaire moyen de 85 000 $ et un total de 1 800 heures de bénévolat effectuées. Le programme coûte au total 180 000 $, couvrant le temps de gestion du personnel, la licence d'une plateforme de bénévolat et le coût complet des heures de bénévolat.
Valeur générée
La valeur de rétention, calculée selon la méthode prudente décrite précédemment, s'élève à environ 573 750 $. La valeur de développement des talents, basée sur une économie de 2 000 $ par participant par rapport à une formation formelle équivalente pour 150 employés, ajoute 300 000 $. La valeur communautaire, en utilisant la référence de 220 $ par heure pour le travail pro bono sur 1 800 heures, contribue à hauteur de 270 000 $.
Calcul final du ROI
La somme des trois sources de valeur donne un bénéfice total de 1 143 750 $. En soustrayant le coût du programme de 180 000 $ et en divisant par ce même coût, on obtient un ROI de 535 %, ce qui signifie que le programme génère environ 6,35 $ de valeur pour chaque dollar investi. Même une version plus prudente de ce modèle, en appliquant une décote supplémentaire de 25 % à chaque source de valeur pour tenir compte de l'incertitude, permet d'atteindre confortablement un ratio de 3:1.
Comment prouver que le bénévolat est la cause du résultat et non une simple corrélation ?
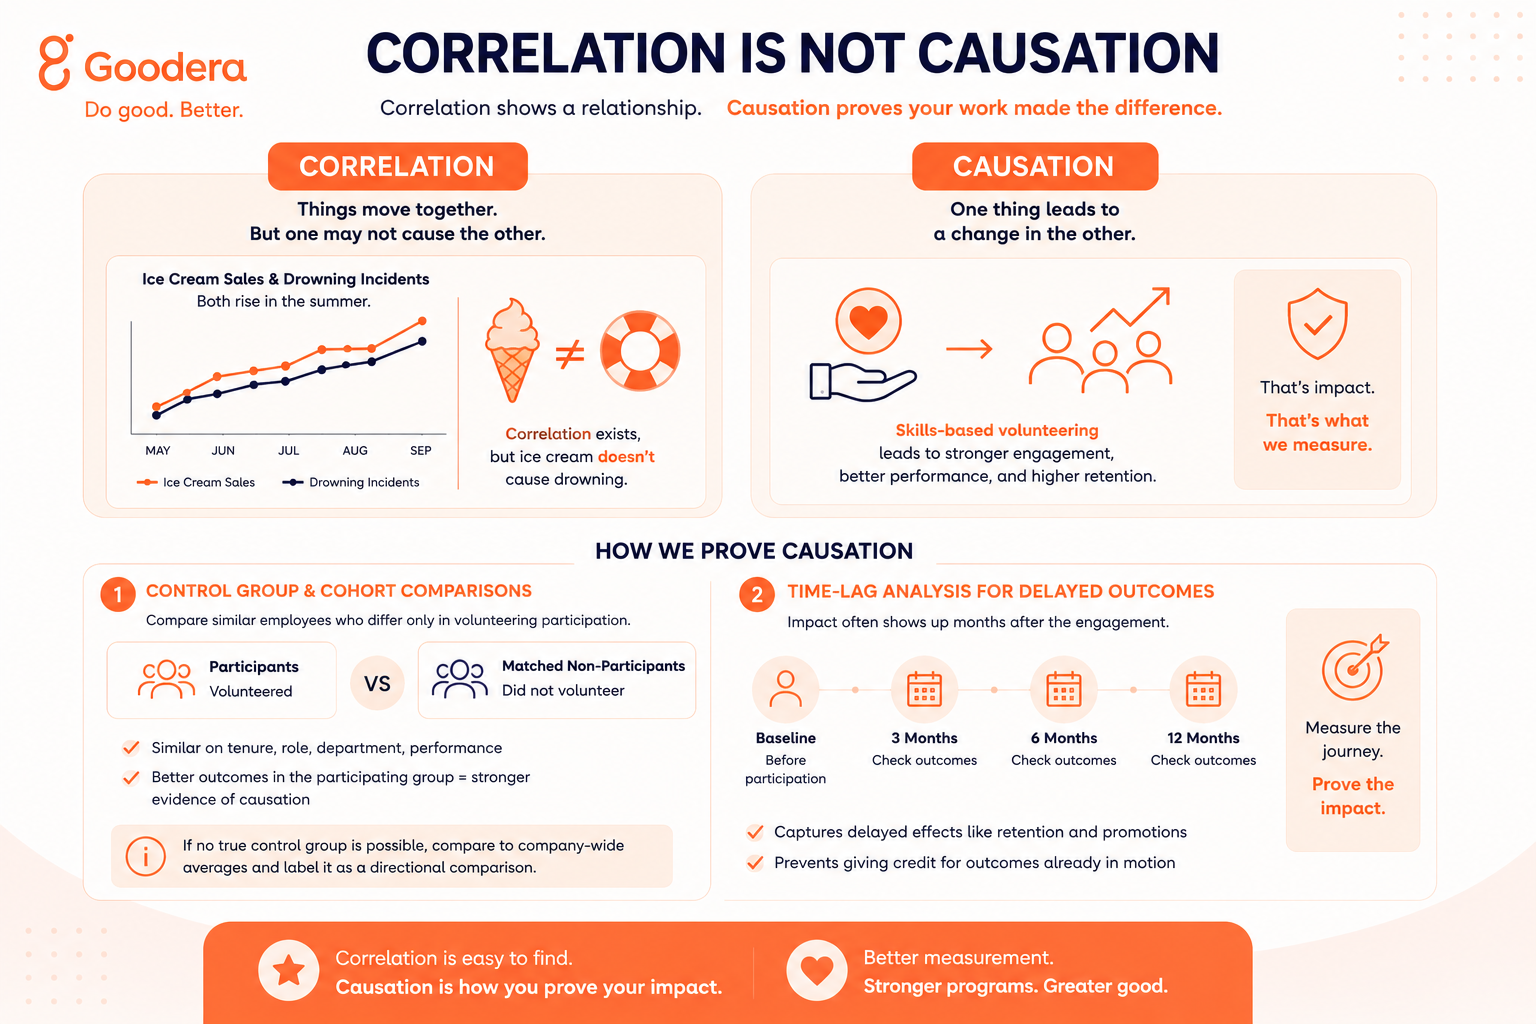
C'est la question qui distingue un chiffre de ROI défendable d'un chiffre fragile, et c'est généralement la première objection soulevée par un partenaire financier sceptique. La corrélation est facile à trouver. La causalité exige une conception plus rigoureuse.
Groupes témoins et comparaisons de cohortes
L'approche la plus fiable consiste à comparer deux groupes d'employés similaires sur toutes les dimensions mesurables, à l'exception de la participation au bénévolat : ancienneté, poste, département et évaluation des performances antérieures. Si la cohorte participante affiche des résultats de rétention ou de performance nettement meilleurs que la cohorte témoin non participante sur la même période, l'argument en faveur de la causalité se renforce considérablement, même sans étude randomisée formelle.
Lorsqu'un véritable groupe témoin n'est pas réalisable, un substitut raisonnable consiste à comparer les participants aux moyennes de l'entreprise pour les mêmes indicateurs, en précisant clairement qu'il s'agit d'une comparaison directionnelle et non contrôlée. La transparence sur les limites de la méthode renforce davantage la crédibilité que la surestimation de la certitude.
Analyse du décalage temporel pour les résultats différés
Certains résultats, notamment la rétention et la probabilité de promotion, mettent des mois à se concrétiser après la fin d'une mission de bénévolat. Suivre les résultats uniquement au cours du trimestre de participation occulte totalement ce décalage. Une analyse du décalage temporel, vérifiant les résultats à trois, six et douze mois après la participation, permet de capturer des effets qu'une enquête immédiate ne pourrait pas déceler.
Cette approche protège également contre un piège courant : attribuer au bénévolat un résultat qui était déjà en cours avant le début de l'engagement. Établir une base de référence pour chaque employé avant sa participation et la comparer à sa trajectoire ultérieure permet de maintenir l'intégrité de l'analyse causale.
Quand faut-il réellement mesurer ? Établir un calendrier réaliste
Les équipes de programme demandent souvent dans quel délai elles peuvent espérer montrer des résultats à la direction, généralement dans les deux ou trois premiers mois d'une nouvelle initiative. La réponse honnête est que les différents indicateurs arrivent à maturité à des vitesses différentes, et définir des attentes claires sur ce calendrier dès le départ permet d'éviter toute déception ultérieure.
Indicateurs à court, moyen et long terme
Présenter ces trois niveaux ensemble, clairement identifiés par échéance, offre à la direction une vision honnête plutôt qu'un chiffre unique extrait prématurément, avant que les données n'aient eu le temps de se consolider :
- Indicateurs à court terme (quelques jours après la fin du projet) : Mesure la satisfaction initiale des participants, les gains de confiance déclarés par les employés et les retours immédiats des associations partenaires.
- Indicateurs à moyen terme (3 à 6 mois après le projet) : Suit les changements de performance observés par les managers, les premiers signaux de rétention des talents et la preuve de la mise en œuvre des solutions par les associations.
- Indicateurs à long terme (12 mois et plus après le projet) : Évalue les comparaisons du taux de rétention annuel de l'entreprise, les données sur les promotions et la mobilité interne des participants, ainsi que l'amélioration durable des capacités des associations partenaires.
Quel est un bon ratio de retour sur investissement (ROI) pour un programme de mécénat de compétences ?
Sur la base de l'exemple ci-dessus et des chiffres comparables publiés dans le secteur, un programme bien structuré doté d'une infrastructure de mesure solide se situe généralement entre 2:1 et 5:1, ce qui signifie deux à cinq dollars de valeur combinée pour chaque dollar dépensé. Les programmes situés dans le bas de cette fourchette sont souvent plus récents et en phase de construction des processus de cadrage et de mise en relation nécessaires aux engagements à plus forte valeur ajoutée. Les programmes situés dans le haut de la fourchette bénéficient généralement de plusieurs années de partenariats associatifs constants et d'un système de mesure déjà mature.
Il est préférable de résister à la tentation de viser un chiffre artificiellement élevé en gonflant les hypothèses d'attribution. Un chiffre prudent de 2:1 à 3:1, en lequel un directeur financier a une confiance totale, est plus précieux, dans tous les sens du terme, qu'un chiffre agressif de 8:1 qui suscite le scepticisme dès que quelqu'un demande comment il a été calculé.
Présenter le ROI au conseil d'administration sans perdre la dimension humaine
Les chiffres apportent une grande crédibilité, mais ils suffisent rarement à convaincre une assemblée. Les meilleures présentations devant un conseil d'administration associent le chiffre du ROI à quelques histoires spécifiques et vérifiables qui illustrent ce que ce chiffre représente concrètement.
Créer un tableau de bord d'une page pour les dirigeants
Un format de tableau de bord efficace tient sur une seule page et comprend quatre sections : le ratio de ROI principal, les trois leviers de valeur qui le composent, les résultats globaux obtenus en termes de capacité pour les associations, et deux ou trois citations courtes de participants ou d'associations. Les dirigeants, qui lisent des dizaines de rapports chaque trimestre, réagissent mieux à un résumé clair et épuré qu'à une annexe dense contenant chaque point de donnée sous-jacent.
Incluez une comparaison avec l'année précédente dans la mesure du possible. Le chiffre du ROI d'une seule année est informatif, mais une courbe de tendance montrant des rendements constants ou en amélioration sur plusieurs années constitue un argument bien plus solide pour justifier la poursuite ou l'extension de l'investissement.
Lier les indicateurs aux exigences de reporting ESG et CSRD
Bon nombre des points de données alimentant votre calcul de ROI répondent également aux exigences de divulgation de cadres tels que la directive CSRD (Corporate Sustainability Reporting Directive) et les normes GRI (Global Reporting Initiative), qui exigent de plus en plus des preuves d'impact social plutôt que de simples comptages d'activités. Structurer votre cadre de mesure une seule fois, puis mapper les résultats à la fois pour le reporting interne du ROI et pour la communication ESG externe, évite de dupliquer les efforts en menant deux processus de collecte de données distincts pour ce qui est, en fin de compte, le même programme.
Erreurs de mesure courantes qui minent vos chiffres
Quelques erreurs récurrentes apparaissent dans des programmes par ailleurs bien gérés. Élaborer un plan de mesure qui évite ces quatre pièges dès le départ permet d'économiser un travail de refonte important par la suite et de produire un chiffre de ROI qui résiste à l'examen.
- Mesurer uniquement les heures et la participation : Indique qu'une activité a eu lieu, mais ne montre pas ce qui a réellement changé ni quelle valeur a été créée.
- Élaborer des cadres après le lancement : Laisse les équipes chargées de l'impact social en entreprise aux prises avec la reconstruction de chiffres de référence qui n'ont jamais été formellement établis.
- Revendiquer une attribution totale : Attribue 100 % des gains de rétention ou de performance au programme sans tenir compte d'autres facteurs, un raccourci que les équipes financières contesteront rapidement.
- Traiter l'expérience des associations comme une note de bas de page : Sous-estime environ un tiers de la valeur totale créée par le programme en ignorant l'amélioration opérationnelle de l'organisation partenaire.
Outils et cadres pour faciliter la mesure
Plusieurs méthodologies établies peuvent apporter une rigueur supplémentaire au calcul du retour sur investissement interne, en particulier lorsqu'un programme est prêt à formaliser ses rapports pour des parties prenantes externes ou pour une présentation au conseil d'administration.
La méthodologie SROI en bref
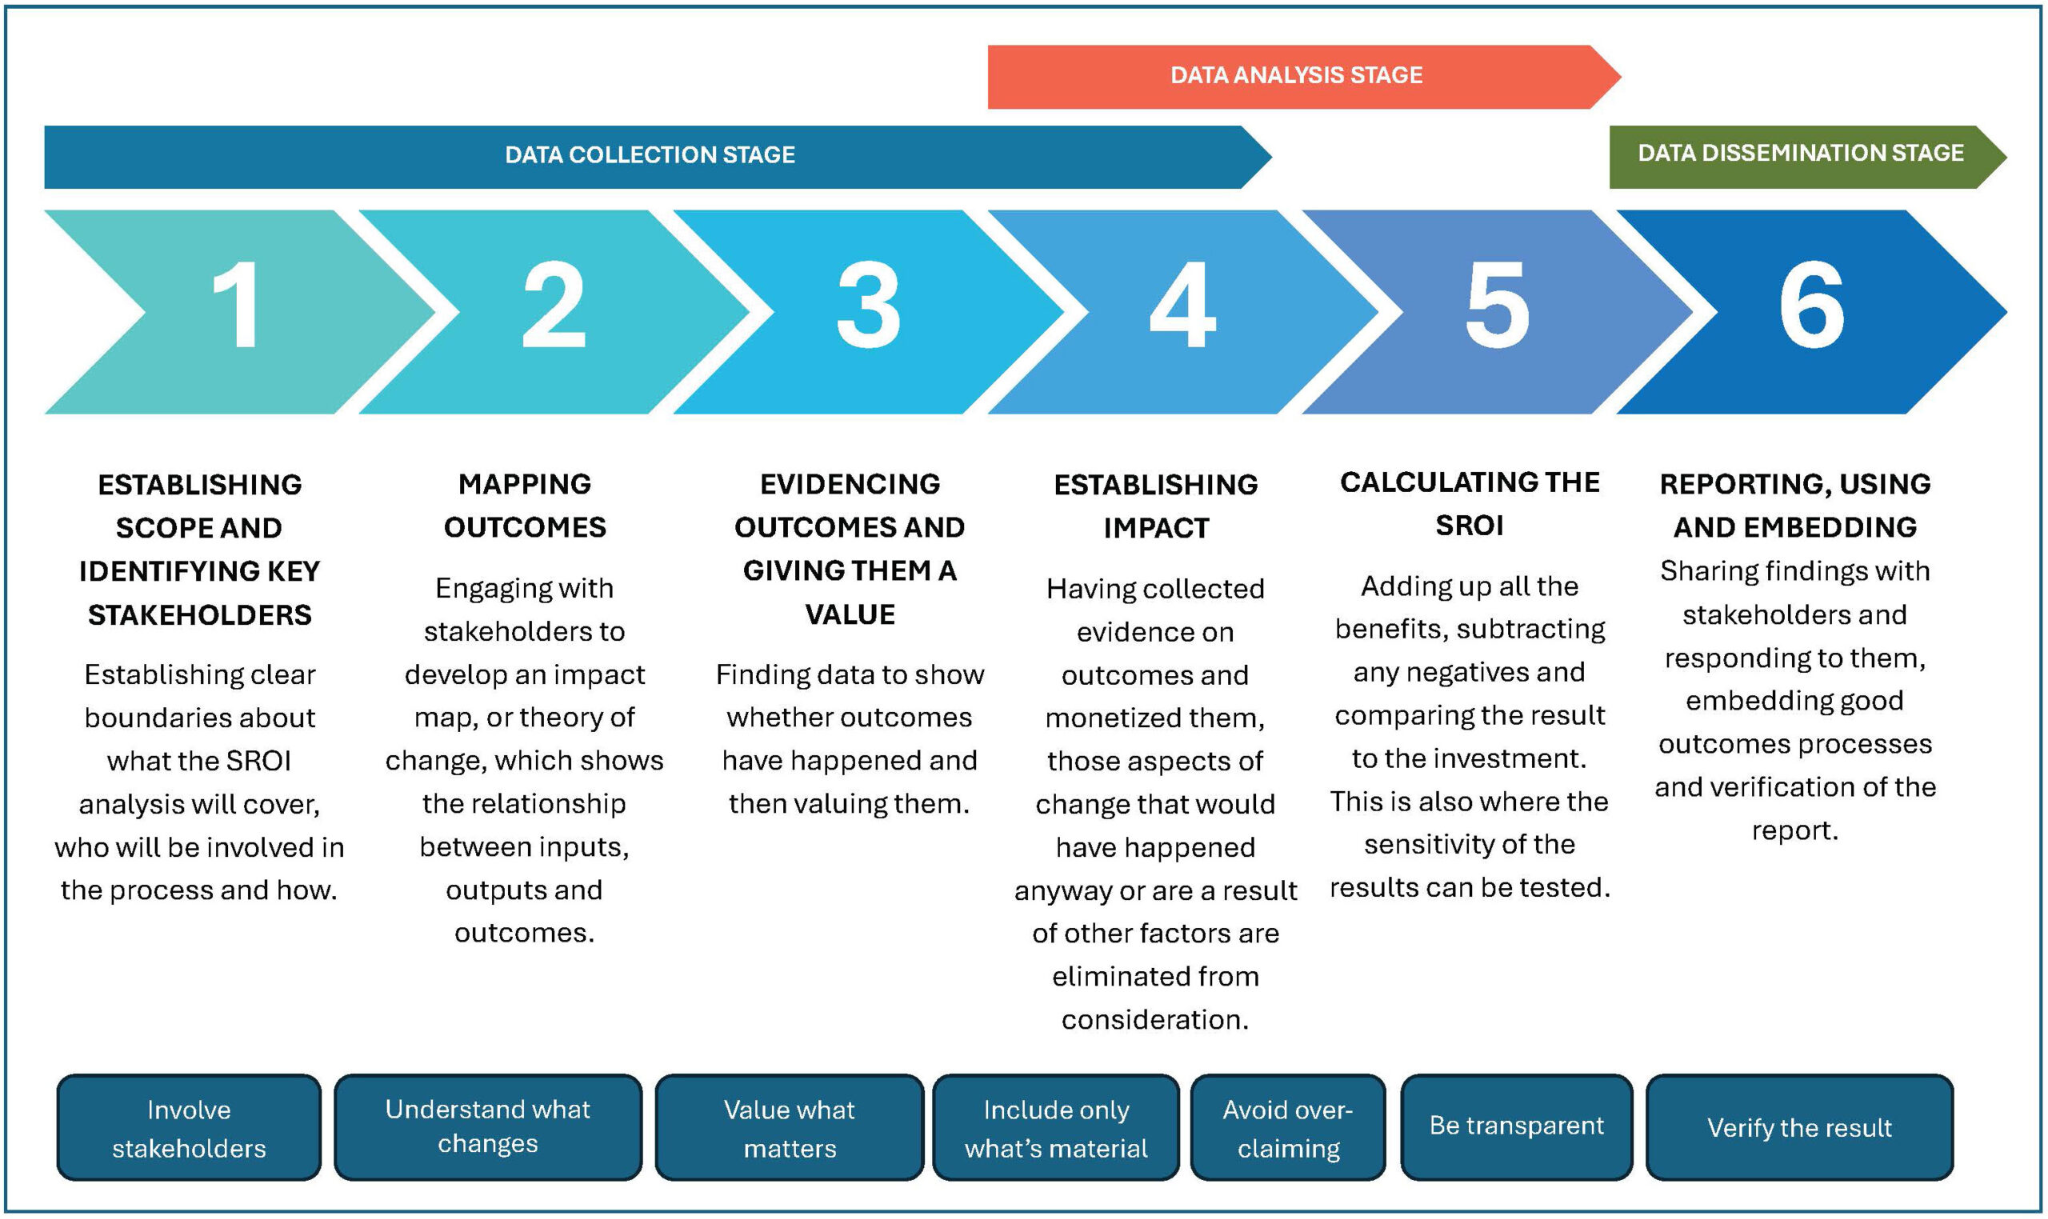
Retour social sur investissement (SROI) est un cadre structuré, géré à l'échelle mondiale par Social Value International, qui attribue des indicateurs monétaires aux résultats sociaux et environnementaux et exprime l'impact total sous forme de ratio par rapport à l'investissement. Il s'inscrit dans la même logique que le calcul du retour sur investissement financier utilisé tout au long de ce guide, mais il est spécifiquement conçu pour les résultats sociaux.
L'analyse SROI implique généralement l'identification des parties prenantes, la cartographie des résultats, l'évaluation de ces résultats à l'aide d'indicateurs et l'application de décotes pour le poids mort et l'attribution, selon les mêmes principes de prudence recommandés plus tôt dans cet article. Les programmes cherchant à obtenir une crédibilité auprès de tiers pour un public externe, comme les investisseurs ou les agences de notation ESG, constatent souvent que l'adoption de la discipline de décote du SROI renforce considérablement un modèle de retour sur investissement élaboré en interne.
Logiciels et tableaux de bord à considérer
Les plateformes de gestion du bénévolat conçues à cet effet proposent de plus en plus de tableaux de bord centralisés qui suivent la participation, les heures, les compétences déployées et les retours des associations en un seul endroit, réduisant ainsi la charge administrative liée à l'extraction de données à partir de multiples feuilles de calcul déconnectées.
Pour éliminer complètement ces systèmes fragmentés, les équipes d'entreprise utilisent le service de bénévolat des employés de Goodera. Goodera fournit une infrastructure de bénévolat gérée de bout en bout qui couvre l'ensemble du cycle de vie du programme :
- Outils de mise en relation algorithmiques : Intègre des outils comme SkillsPlus de Goodera pour aligner automatiquement les compétences professionnelles des employés (technologie, marketing, juridique, RH) avec des opportunités associatives vérifiées et aux missions clairement définies.
- Infrastructure de mesure intégrée : Consolide la collecte de données dès le départ grâce à des systèmes de suivi qui enregistrent les heures de bénévolat, les compétences utilisées et les retours des associations dans une vue unique.
- Tableaux de bord d'entreprise : Génère des rapports de données agrégées en temps réel qui s'intègrent parfaitement aux présentations d'entreprise et aux rapports ESG plus larges.
En déployant un écosystème tout-en-un via la mise en relation à grande échelle des employés de Goodera avec des opportunités de bénévolat fondées sur les compétences, les responsables RSE peuvent se concentrer sur une stratégie à plus forte valeur ajoutée et sur la gestion des parties prenantes plutôt que sur la mise en relation administrative manuelle.
En résumé : faire de la mesure une habitude
Les programmes qui affichent les meilleurs retours sur investissement année après année partagent un point commun : ils considèrent la mesure comme une discipline continue intégrée au programme dès le premier jour. Établir votre base de coûts, définir vos gisements de valeur et fixer un calendrier de reporting réaliste avant même que votre prochaine cohorte de bénévoles ne commence son premier projet vous permet de répondre à la question du ROI avec assurance, que ce soit lors de la préparation du budget, d'un audit ESG ou d'une discussion informelle avec un directeur financier dans les couloirs.
Le bénévolat fondé sur les compétences a déjà prouvé sa valeur dans un large éventail de secteurs et de tailles d'entreprises. Il s'agit désormais simplement de développer la capacité de mesure nécessaire pour démontrer cette valeur de manière claire, cohérente et avec des chiffres auxquels tout le monde peut se fier.
Frequently Asked Questions
1. Combien de temps faut-il généralement pour qu'un programme de mécénat de compétences génère un retour sur investissement mesurable ?
La satisfaction et les retours des associations apparaissent en quelques jours. Les indicateurs de rétention et de performance nécessitent trois à six mois, et de nombreux programmes peinent à démontrer un retour sur investissement dans les sept à huit mois, simplement parce qu'aucune base de référence n'a été établie avant le lancement.
2. Le mécénat de compétences justifie-t-il des coûts administratifs plus élevés que le bénévolat traditionnel ?
Par heure, les programmes de mécénat de compétences coûtent environ trois fois plus cher à gérer, principalement en raison du travail de cadrage et de mise en relation. Pour la plupart des entreprises, la rétention et la valeur communautaire générées par heure justifient largement ce surcoût.
3. Quel est le taux de référence standard pour valoriser une heure de mécénat de compétences ou de pro bono ?
La valeur de référence nationale pour une heure de bénévolat général s'élève à 36,14 $, selon les estimations de l' Independent Sector et du Do Good Institute. Pour les engagements d'entreprise qualifiés ou pro bono, les équipes financières devraient abandonner les moyennes forfaitaires et utiliser les salaires horaires par profession du Bureau of Labor Statistics (BLS). Aligner votre valeur directement sur des rôles départementaux spécifiques — tels que les ingénieurs logiciels, les juristes d'entreprise ou les directeurs marketing — fournit un taux de référence hautement défendable et audité qui résiste à l'examen financier de la direction.
4. Avons-nous besoin d'un cadre de mesure distinct pour le mécénat de compétences, ou pouvons-nous l'intégrer aux indicateurs existants ?
Il est utile de créer un niveau de mesure distinct. Le suivi horaire standard capture rarement ce dont le travail de compétences a le plus besoin : les compétences déployées, la qualité des livrables et les résultats en matière de capacité des associations.
5. Devons-nous présenter le retour sur investissement uniquement sous forme de montant financier, ou la direction attend-elle également des témoignages qualitatifs ?
L'idéal est de rapporter les deux, en adoptant une stratégie à deux volets qui saisit toute l'ampleur de l'impact de votre programme. Si les parties prenantes exécutives ont besoin de mesures financières concrètes pour justifier le budget, le suivi des effets qualitatifs et transformateurs sur votre culture d'entreprise est tout aussi crucial, car il renforce la bienveillance du public et la confiance envers la marque.
6. Comment confirmer que les employés appliquent réellement les compétences acquises grâce au bénévolat dans le cadre de leur travail ?
Comparez les résultats des évaluations de performance des participants avec ceux d'un groupe témoin non participant, en faisant des points à trois, six et douze mois plutôt que juste après la fin du projet. Le transfert de compétences différé est courant, et une enquête unique après l'événement risque de passer à côté.
7. Quel est le principal obstacle qui empêche les employés de participer, et cela affecte-t-il la façon dont nous mesurons l'engagement ?
Une enquête du National Council for Voluntary Organisations a révélé que le manque de temps est systématiquement la première raison du désengagement des employés. Un taux de participation stable ou en baisse indique souvent des contraintes de temps plutôt qu'un désintérêt.
8. Comment obtenir des partenaires associatifs qu'ils fournissent de manière fiable les données de résultats dont dépend notre calcul de retour sur investissement ?
Intégrez une courte évaluation des capacités en cinq questions dans l'accord de projet dès le départ, avec un point de contrôle avant l'engagement et un autre trois à six mois après. Présenter cela comme une responsabilité mutuelle permet d'obtenir des taux de réponse bien plus élevés qu'avec une enquête envoyée à froid.
9. Quels cadres de reporting ESG ou de durabilité exigent réellement des données sur le bénévolat basé sur les compétences ?
Les données sur le bénévolat basé sur les compétences répondent directement aux exigences de reporting sur le capital humain et l'impact social des principaux cadres ESG comme le GRI et le SASB. Plus précisément, les programmes de bénévolat basé sur les compétences valident le développement des employés selon les normes GRI 401/413, fournissent des preuves matérielles de l'engagement des talents pour le SASB et soutiennent les mandats de la CSRD (ESRS S1 et S4) concernant les indicateurs communautaires et liés à la main-d'œuvre. Cartographier ces données dès le début évite la duplication des mesures entre les équipes de conformité.
10. De combien d'années de données avons-nous besoin avant de présenter un chiffre de retour sur investissement crédible au conseil d'administration ?
Une seule année suffit, à condition que votre base de coûts et vos hypothèses d'attribution soient conservatrices et documentées. Une tendance sur plusieurs années renforce encore le dossier, car un ratio constant ou en amélioration sur plusieurs cycles est perçu comme plus crédible qu'une année forte sans lendemain.


.webp)