Global Trends in Corporate Volunteering in 2026: What the Data Is Really Telling You

Something meaningful is happening in corporate volunteering. Across thousands of companies, more employees are signing up, more programs are running year-round, and more organizations are treating volunteering as a business function rather than a feel-good initiative.
These shifts reflect some of the biggest global trends in corporate volunteering today. Companies are investing more in employee engagement, expanding access to volunteering opportunities, and making volunteer participation part of broader workplace culture.
But the headline numbers only tell part of the story.
The Goodera Volunteering Quotient (VQ) Report 2026 analyzed data from more than 3,000 companies worldwide, including detailed reporting from 240 organizations. The findings reveal a more nuanced reality beneath the growth. Employee participation in corporate volunteering programs is increasing, but the depth of engagement is not.
More employees are volunteering. However, most participate only once or for a short period of time, without a clear path back into future opportunities.
That gap, between showing up and staying engaged, is where the real work of building an effective volunteering program begins.
This guide breaks down the key current trends in volunteering from the VQ Report 2026. More importantly, it explores what these trends in volunteering actually mean for organizations and what companies can do next to build stronger, more sustainable participation.
What Are the Biggest Global Trends in Corporate Volunteering Right Now?
The clearest signal from the VQ 2026 data is that corporate volunteering has moved from optional to expected. Structured programs, formal policies, and dedicated infrastructure are now the norm rather than the exception. The question is no longer whether to have a volunteering program. It's how well that program is designed.
Here are the eight most significant trends shaping employee participation in corporate volunteering programs in 2026, and what each one means for how companies should respond.
Trend 1: Participation Is Rising, But It Strongly Depends on Program Maturity
Corporate volunteering participation is moving in the right direction. More employees are getting involved, and more organizations are actively investing in programs that make volunteering easier to access and more visible across the workforce. The overall trajectory signals steady momentum, with volunteering gradually becoming a more regular part of the employee experience rather than an occasional initiative.
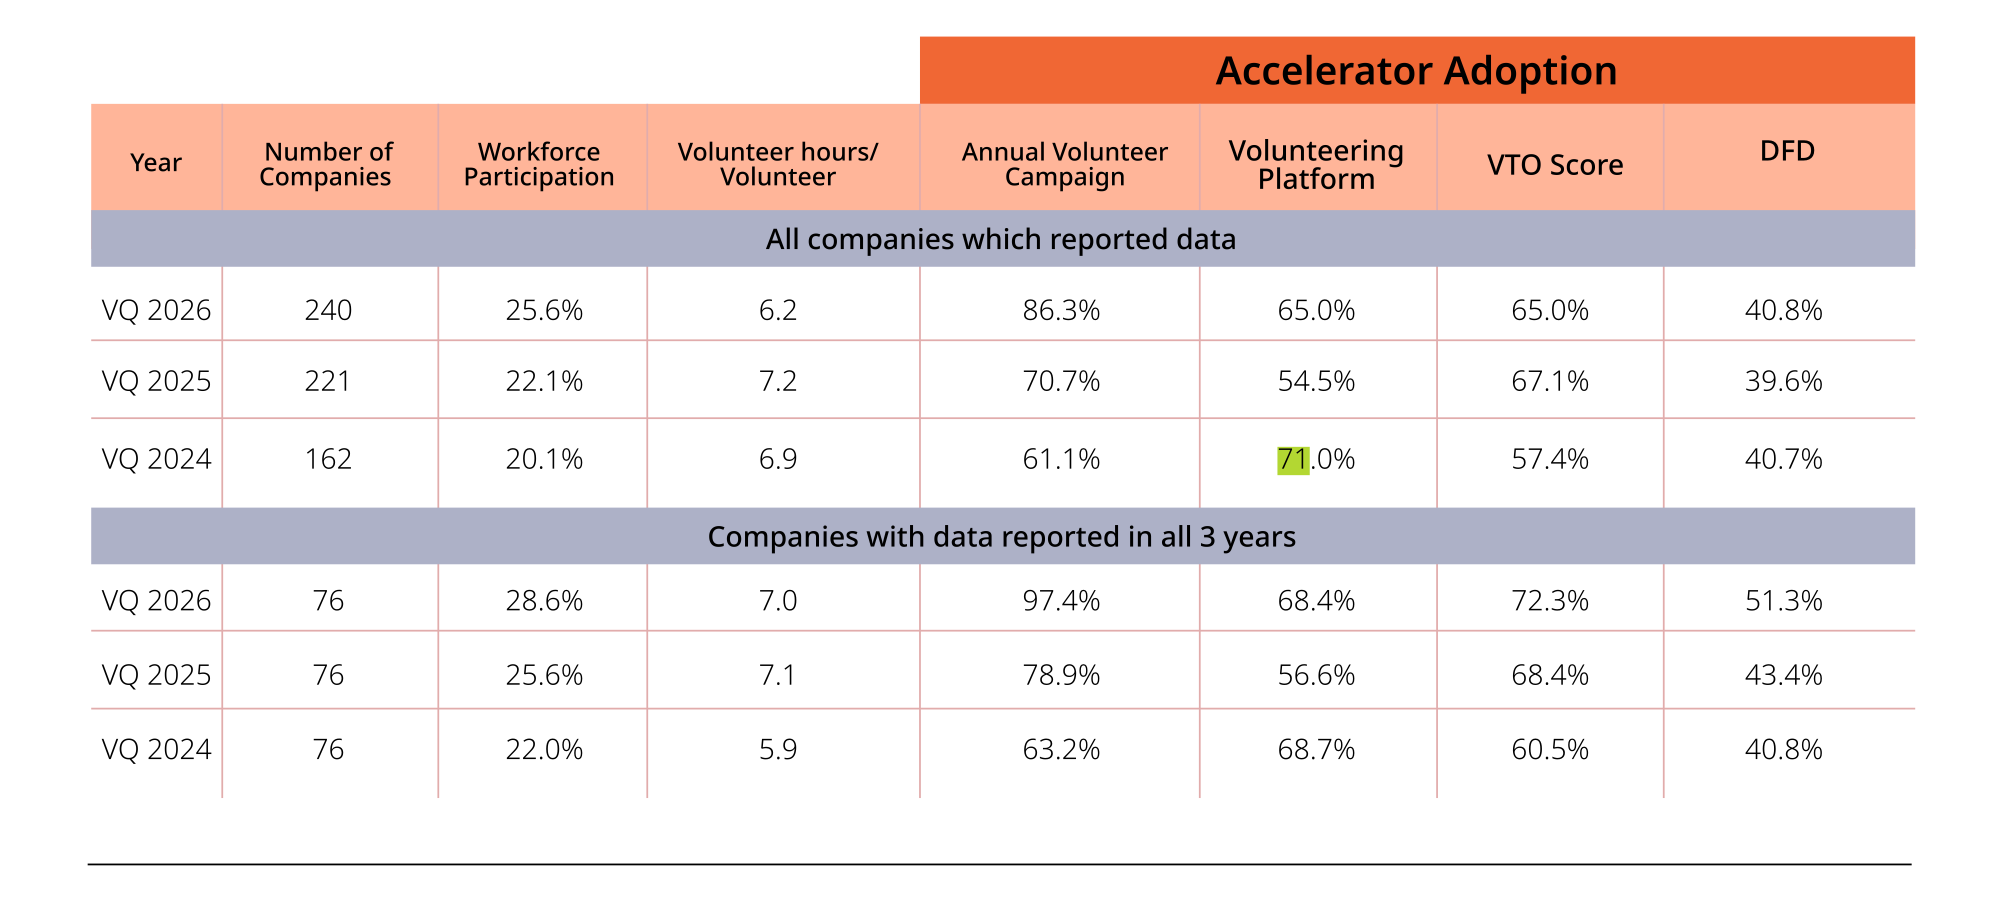
The data supports this upward trend. Median workforce participation across 240 companies reached 25.6% in 2026, up from 22.2% in 2024. Among the 76 companies tracked consistently over the three-year period, participation shows sustained growth, with a CAGR of 19.7%, reinforcing that engagement is expanding rather than plateauing.
However, the quartile distribution shows that this growth is not evenly spread across organizations. Participation is heavily shaped by program maturity. Companies with fully embedded volunteering programs see engagement levels as high as 70%, while organizations with structured but early-stage programs average around 20%, and those running mostly ad-hoc initiatives see participation fall to just 7.1%.
This spread makes the underlying reality clearer: growth in participation is real, but it is concentrated in organizations that have built volunteering into their culture and operating model. For most others, engagement remains limited to a smaller, self-selecting group of employees rather than the broader workforce.
In that sense, volunteering is expanding, but it is still unevenly distributed across companies and has not yet reached consistent, organization-wide adoption.
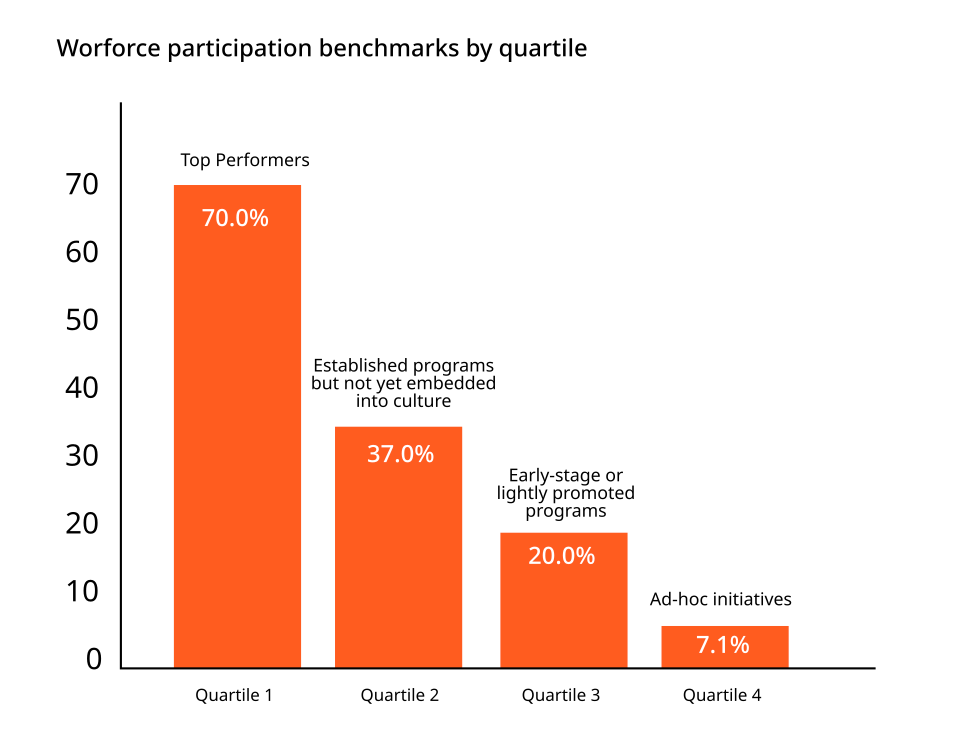
Three in four employees at the average company still aren't volunteering at all. The growth is real, but the ceiling reveals how much room remains. The companies hitting 70% participation aren't doing the same thing as the companies stuck at 7%. They've built an entirely different infrastructure. High-performing programs combine year-round campaigns, volunteering platforms, Volunteer Time Off policies, recognition incentives, and local champion networks that actively drive participation across teams.
The result is a culture where volunteering is consistently promoted, easy to access, and reinforced by peers and leaders alike, rather than being limited to a few annual events
The VQ 2026 data show a stark maturity curve: ad hoc programs average just 7.1% participation. Early-stage programs with some structure reach around 20%. Established programs with strong culture hit 37%. And top performers with volunteering fully embedded into their organizational culture reach 70%.
If your participation rate sits below 25%, the primary issue isn't employee motivation. It's access to structure and awareness. If you're between 25% and 40%, your next lever is sustained engagement, converting first-time participants into repeat volunteers.
If you're above 40%, the work shifts to deepening impact and measuring outcomes, not just headcount.
Actions to take:
- Audit your barriers first. Survey employees who haven't volunteered and ask specifically what stopped them. Time, awareness, relevance, and scheduling conflicts are the most common blockers.
- Set a participation target by quartile. Aim to move your program up one maturity level in 12 months, not from bottom to top in one year.
- Treat first-time volunteers as the top of a funnel. Design a follow-up experience that invites them back within 90 days.
Trend 2: Volunteer Hours Dip Slightly, But Large Firms Still Lead in Engagement Intensity
Participation rates show how many employees are getting involved. Volunteer hours show whether that involvement is deep enough to create sustained impact.
Across 240 companies, the median volunteering time is 6.2 hours per volunteer, indicating relatively light engagement per participant. Among the 76 companies tracked consistently over three years, average hours increased from 5.9 hours in 2024 to 7.1 hours in 2025, before stabilizing at 7.0 hours in 2026.
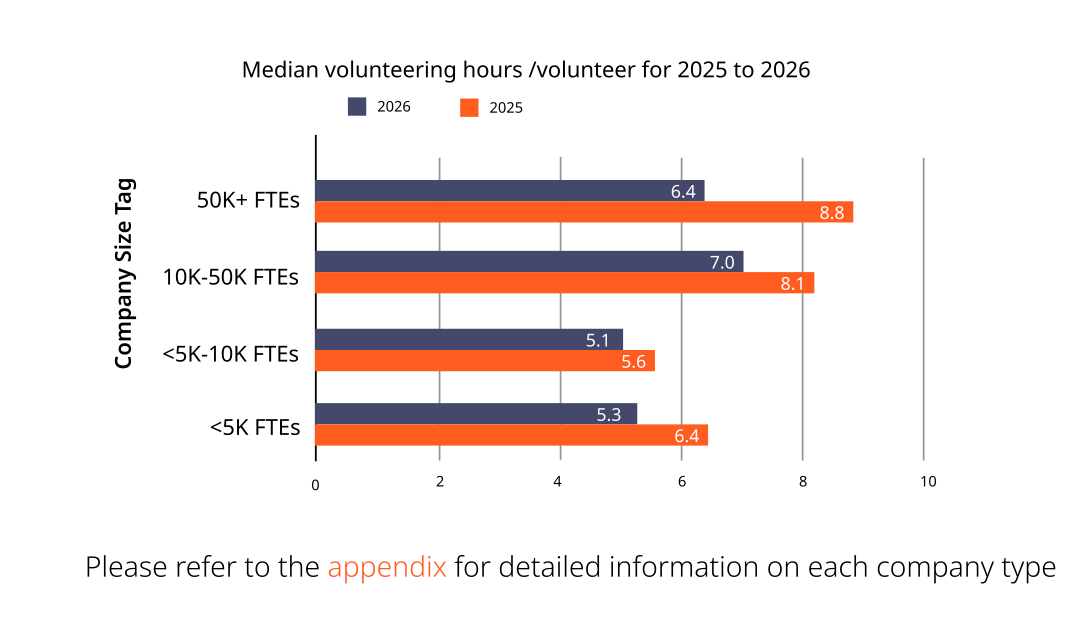
This pattern suggests a clear divergence: participation is expanding, but depth of engagement is not growing at the same pace. Organizations appear to be becoming more effective at bringing first-time volunteers into programs, while struggling to consistently drive repeat or longer-duration involvement.
The quartile breakdown reinforces this view. Larger enterprises tend to sustain higher volunteer intensity, while mid-size and smaller organizations show comparatively lower hours per volunteer, pointing to structural differences in how programs are designed and resourced.
This matters because the impact of volunteering compounds with time. Short, one-off engagements create exposure, but sustained involvement is what drives skill development for employees and deeper outcomes for communities.
A plateau in volunteer hours often reflects program design. Where volunteering is structured around episodic events, organizations tend to generate participation moments. Where it is designed as an ongoing journey, employees are more likely to stay engaged for longer, and impact becomes more meaningful over time.
What you should do:
- Design a three-tier engagement model. Entry level: one-time events and care kit assemblies for new volunteers. Mid-level: recurring monthly activities for engaged employees. Advanced level: skills-based projects and long-term nonprofit partnerships for high-commitment volunteers.
- Create visible pathways between tiers. After each activity, tell participants what the next step looks like. Don't leave them to find it on their own.
- Track return rate, not just participation rate. The percentage of volunteers who come back within 12 months is one of the strongest indicators of program health.
Trend 3: Program Structure Predicts Participation More Than Anything Else
When participation rates differ dramatically between companies, it's tempting to assume the cause is culture. In reality, the biggest difference often comes from something much more practical: whether employees have clear, accessible ways to get involved.
Companies using all four volunteering accelerators (annual campaigns, digital platforms, VTO, and Dollars for Doers) see 3.1x higher workforce participation than companies that use none. Annual campaigns alone deliver 2.6x higher participation. Digital platforms deliver 1.3x. VTO delivers 1.4x.
The single biggest predictor of whether your employees volunteer is not your company culture, your CEO's enthusiasm, or your communications strategy. It's program architecture. Employees at well-structured programs volunteer at three times the rate of those at poorly structured ones, even when motivation levels are comparable.
This is the most important inference in the entire report, and the most underappreciated one. Most organizations try to increase volunteer participation by communicating more. The data says: build better systems first, then communicate.
If you have one accelerator, adding a second produces compounding returns. The order of priority based on impact data is: annual campaign first (2.6x), then VTO (1.4x), then platform (1.3x), then Dollars for Doers for deepening engagement with committed volunteers.
Actions to take:
- If you have no accelerators: Start with an annual campaign. It's the highest-impact single investment and the most widely adopted (86.3% of companies now run one).
- If you have a campaign but no VTO: Make the business case for a VTO policy. Use the 1.4x participation multiplier as the headline number in that conversation.
- If you have all four: The competitive advantage now sits in execution quality, not adoption. Focus on how well your campaign is run, how friction-free your platform experience is, and how clearly your Dollars for Doers thresholds incentivize depth over token participation.
Trend 4: Industry and Company Size Tell You What to Benchmark Against
A participation rate only becomes meaningful when you know what you're comparing it against. A 25% participation rate might be exceptional in one industry and underwhelming in another. The same is true for company size.
Financial services leads all industries at 36.4% median participation, followed by healthcare at 28.7% and technology at 27.6%. By company size, organizations under 5,000 employees lead at 48% participation, followed by mid-sized companies (5,000 to 10,000 employees) at 33.9%.

The participation gap between small and large companies isn't really about size. It's about coordination complexity. Smaller organizations have fewer layers between a decision to run a volunteer event and the employee signing up for it. Larger organizations have distributed workforces, multiple time zones, and regional differences in cause preferences that make scaling exponentially harder.
The financial services lead is equally instructive. The sector's historically strong ESG infrastructure, combined with mature community investment traditions, has created a compounding advantage over the years. Technology's jump from 22.6% to 27.6% in a single year is the more interesting signal: it suggests that when tech companies invest in program structure, they close the gap quickly.
These numbers are your true benchmarks. If your company has 10,000 to 50,000 employees, the median is 23.9%, meaning 30% is an ambitious but achievable near-term target. If you're in financial services and sitting below 30%, something structural is broken.
Actions to take:
- Benchmark against your industry and size cohort, not the global median. Aspirational benchmarks from top performers are useful for direction, not for annual goal-setting.
- For large enterprises: Build a champion network of local volunteer leads before you build anything else. The VQ data on Arrow Electronics shows that expanding from 25 to 155+ local champions produced an 80% increase in participation in a single year. Local ownership scales what central mandates can't.
- For smaller organizations: Your structural advantage is proximity. Use it deliberately by making volunteering visible in every all-hands, every team meeting, every onboarding session.
Trend 5: The Cause Area Mix Reveals a Strategic Blind Spot
The causes companies choose to support can tell you just as much about a volunteering program as participation rates or volunteer hours. Looking at where employees are spending their time reveals which issues are receiving attention, and which may be getting overlooked.
Child welfare and education accounts for 43% of all volunteering events in 2026, up from 32% the previous year. Community welfare accounts for 24%. Environment and sustainability accounts for 10%. All other causes, including skill development, women's causes, food security, and D&I, make up the remaining quarter.
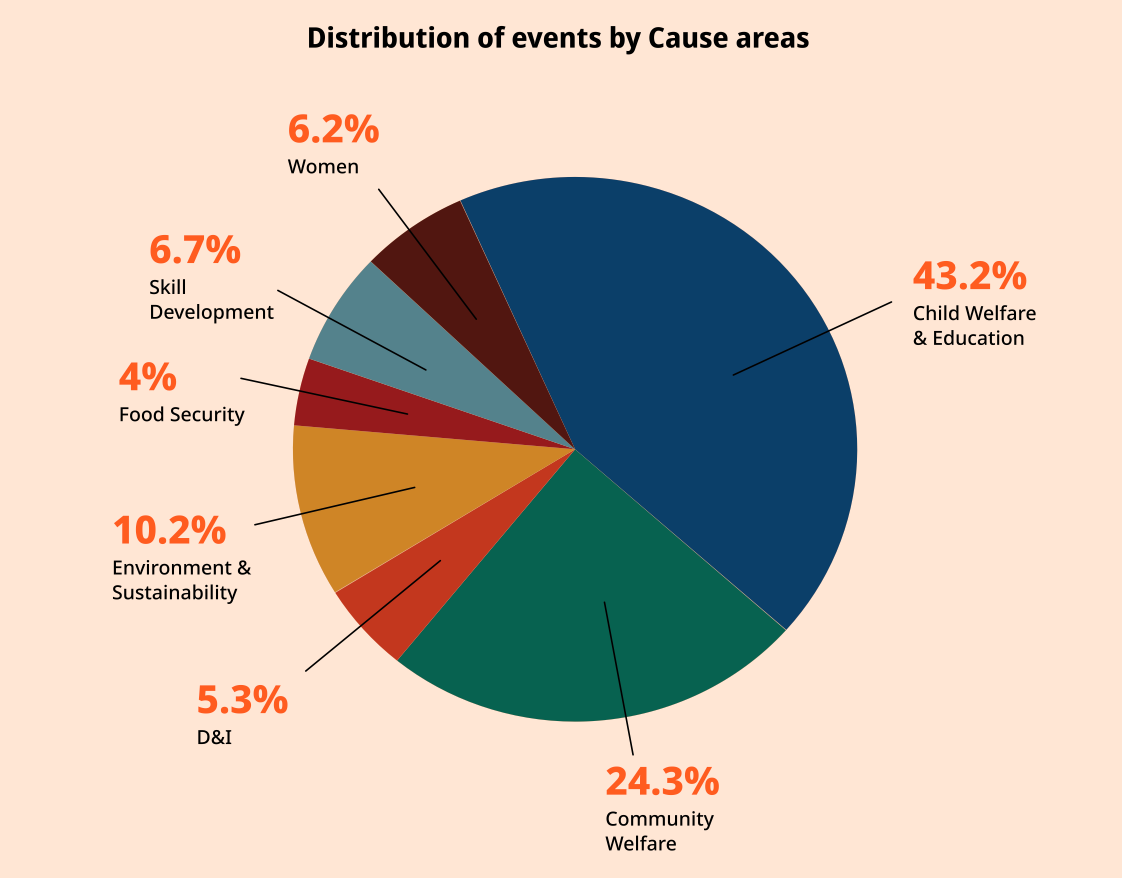
The concentration in education and community causes isn't inherently a problem. These are high-need areas with genuine volunteer demand. But the sharp growth in education's share, from 32% to 43% in a year, suggests that many companies are defaulting to familiar, accessible cause areas rather than strategically choosing where their volunteers can create the most differentiated impact.
This is a volunteering report finding worth sitting with: when 43% of your portfolio is in one cause area, you've almost certainly left some employees behind. The 10% of your workforce passionate about environmental causes, the employees who care deeply about women's economic empowerment, or the veterans who want to support their community are all less likely to find a natural entry point.
Cause concentration is often a symptom of defaulting to what's easiest to organize, not what employees care about most. A diversified cause portfolio isn't about covering every issue. It's about ensuring that across your workforce, every employee can find something that genuinely moves them.
Actions to take:
- Run an annual cause preference survey. Ask employees which cause areas matter most to them. The results will almost always surprise you.
- Build a quarterly calendar that reflects the results. Q1 can anchor to women's causes (IWD, Women's History Month). Q2 to the environment (Earth Month). Q3 to skill development and economic empowerment. Q4 for food security and community relief.
- Use seasonal peaks deliberately. The VQ data shows Q4 accounts for 33% of all events, mostly driven by holiday-season momentum. Plan your highest-participation campaigns for Q4, but don't let Q1 and Q3 run on autopilot.
Trend 6: In-Person Volunteering Dominates, and That's an Engagement Signal
The format of a volunteering program influences not only how employees participate, but how deeply they connect with the experience. Looking at participation patterns reveals a clear preference that has remained remarkably consistent.
86.2% of volunteers chose in-person formats in 2026, while virtual formats accounted for 13.8% of volunteers despite representing 26.5% of scheduled events. India averaged 64 volunteers per event, North America 46, and APAC (excluding India) 45.
Employees are voting with their feet. The gap between virtual event supply (26.5% of events) and virtual volunteer demand (13.8% of participants) tells you that employees are choosing in-person over virtual when both options are available. This is an engagement signal, not just a format preference. In-person volunteering creates the direct, visible, social experience that drives the emotional connection people come back for.
The regional data carries a practical lesson too. India's 64-volunteer average per event reflects a culture of collective, community-oriented service that produces natural participation momentum. North American programs tend toward smaller, more structured group formats. Neither is wrong, but designing a one-size-fits-all program across both regions will underperform in both.
Virtual volunteering is valuable for accessibility, reach, and flexibility. But if your entire program is virtual, you're working against an engagement headwind. The best programs use virtual formats to complement in-person ones, not to replace them.
Actions to take:
- Prioritize at least one in-person event per quarter for teams that are geographically concentrated. The ROI on engagement, depth, and team connection is significantly higher.
- Redesign virtual activities around interactivity. Passive virtual volunteering (watching a webinar, filling a form) produces low engagement. Interactive formats (mentoring sessions, collaborative content creation, live workshop facilitation) close much of the gap.
- Localize your global programs. Don't run the same event format across India, North America, and Europe and expect identical results. Adapt group sizes, cause selections, and activity formats to what resonates regionally.
Trend 7: Skills-Based Volunteering Is Becoming a Core L&D Strategy
For years, volunteering and employee development were treated as separate initiatives. One belonged to CSR, the other to Learning and Development. The latest data suggests those lines are beginning to blur.
92% of business leaders agree that volunteering improves professional skills, according to Deloitte. The VQ 2026 report identifies skills-based volunteering as a fast-moving transition from niche offering to core Learning and Development strategy. Separately, Goodera's survey of 1,000+ nonprofits found that while 71% want to use AI for operational efficiency and 76% see value in AI literacy for their communities, only 25% are actively using AI tools.
Skills-based volunteering is at an inflection point. From the employee side, it's being repositioned from CSR activity to experiential learning, a way to build leadership, agility, and cross-functional problem-solving in conditions that traditional training cannot replicate. From the nonprofit side, the AI literacy gap creates an urgent, specific, and high-value opportunity for tech-skilled volunteers to make a contribution that no amount of care kit assembly can match.
This is the volunteering trend with the most direct business case for L&D budget holders. When a software engineer spends two days helping a nonprofit implement an AI workflow, they're not just giving back. They're practicing implementation, stakeholder communication, and technical translation under real conditions, skills their company would otherwise pay a training vendor to simulate.
If your volunteering program lives entirely in CSR and has no connection to your L&D or talent development strategy, you're leaving a significant internal business case on the table.
Actions to take:
- Map skills-based volunteering opportunities to your competency framework. Identify which roles in your organization produce capabilities (data analysis, legal, marketing, engineering, finance) that nonprofits urgently need.
- Create a formal skills-based volunteering track within your broader program, with longer time commitments, structured project scopes, and clear learning outcomes.
- Start with AI literacy as a pilot cause. The demand from nonprofits is documented, the skills gap is specific, and the volunteer experience is structured enough to produce measurable outcomes on both sides.
Trend 8: Measurement Is Still Activity-Based, and That's a Problem
What gets measured shapes what gets prioritized. In employee volunteering, most organizations have become very good at tracking activity. The challenge is that activity alone doesn't tell the full story of a program's value.
Today, the most common volunteering metrics remain participation rates and volunteer hours. These numbers are easy to collect, simple to report, and useful for understanding program reach. However, they primarily answer questions about how much volunteering happened, not what changed because of it.
The VQ 2026 report identifies a clear shift in thinking, toward measuring outcomes (employee engagement change, skill gains, nonprofit capacity improvement) and long-term impact (retention rates, community transformation), but notes this transition is still in its early stages.
Participation rate and volunteer hours are necessary metrics. They're not sufficient ones. A company that logs 10,000 volunteer hours across 500 employees has demonstrated activity. It has not demonstrated impact. Without outcome measurement, the volunteering budget competes in the same conversation as other discretionary spending, on optics rather than on evidence.
The practical consequence is strategic. Programs that can show that volunteering reduces attrition, improves engagement scores, or builds specific competencies earn sustained investment and executive sponsorship. Programs that can only show hours logged are perpetually vulnerable to cost-cutting.
The transition from activity measurement to outcome measurement doesn't happen overnight. But it has to start somewhere.
Actions to take:
- Add three outcome questions to your post-volunteer survey: Did this experience connect you more strongly to the company's values? Did you use or develop a professional skill? Do you feel more likely to recommend this company as an employer? These three questions begin building the link between volunteering and engagement.
- Partner with HR to correlate volunteering data with retention data. You don't need a formal study. A basic analysis of whether employees who volunteer have lower 12-month attrition than those who don't is enough to build the business case.
ALSO READ: Why Corporate Volunteering Is Becoming a Core HR Strategy in 2026
- Set one outcome target alongside your participation target. For example: "Increase participation to 30% AND achieve a volunteer return rate of 50% within 12 months." The second number forces you to design for depth, not just breadth.
What Do All These Trends Add Up To?
The clearest inference from reading all eight trends together is this: corporate volunteering has scaled successfully. The infrastructure now exists, the culture is shifting, and participation is growing. What hasn't scaled at the same rate is depth, quality, and measurable impact.
The companies that will lead in employee participation in corporate volunteering programs over the next five years are not the ones that run the most events. They're the ones that build journeys: from a first-time participant to a returning volunteer, from an in-person event to a skills-based project, from headcount metrics to genuine impact evidence.
That transition requires different program design, different measurement, and different internal partnerships (with HR, L&D, and regional leadership), not just better communications.
Frequently Asked Questions
1. What does the Goodera VQ Report 2026 cover?
The Goodera Volunteering Quotient Report 2026 is one of the most comprehensive volunteering report publications in the corporate sector. It analyzes data from 3,000+ companies worldwide, with detailed benchmarks from 240 publicly reporting organizations.
It covers workforce participation rates by industry and company size, the impact of specific volunteering accelerators, cause area preferences, format trends (in-person vs. virtual), regional engagement data, and emerging trends in skills-based volunteering and AI literacy.
2. What is the average volunteer participation rate in corporate programs?
The VQ 2026 report puts the median workforce participation rate at 25.6% across 240 companies. Top-performing companies reach 70% participation. Companies with no structural program accelerators average 7.1%.
The gap is almost entirely explained by program design, not employee intent.
3. Which industries have the highest volunteer participation rates?
According to the VQ 2026 data, financial services lead at 36.4% median participation, followed by healthcare at 28.7% and technology at 27.6%. Technology showed the sharpest year-over-year growth, rising from 22.6% to 27.6%, suggesting that structured program investment can close industry gaps quickly.
4. What are the most effective ways to increase employee participation in volunteering?
The VQ 2026 data points to four key accelerators: annual flagship campaigns (2.6x participation lift), VTO policies (1.4x lift), digital platforms (1.3x lift), and Dollars for Doers programs. Companies using all four see participation 3.1x higher than those using none.
Beyond accelerators, local champion networks, tiered engagement models, and cause area diversification are the next most significant levers.
5. What are the emerging trends in corporate volunteering for 2026 and beyond?
The two strongest emerging trends from the VQ 2026 report are skills-based volunteering and AI literacy support for nonprofits. Skills-based volunteering is transitioning from a niche offering to a core L&D strategy, with 92% of business leaders agreeing it builds professional skills. The AI literacy gap in nonprofits (71% want it, 25% have it) creates a specific, high-demand opportunity for tech-skilled corporate volunteers.
Both trends point toward volunteering programs that deliver dual value: community impact and genuine employee development.
6. How should companies measure the impact of their volunteering programs?
Most programs currently measure participation rates and volunteer hours, which capture activity but not impact. The VQ 2026 report advocates for a shift toward outcome measurement: employee engagement scores, skill development levels, volunteer return rates, nonprofit capacity improvement, and ultimately, long-term retention data.
The most practical starting point is adding outcome questions to post-volunteer surveys and correlating volunteering participation with HR data on engagement and attrition.
7. What is skills-based volunteering and why is it becoming standard?
Skills-based volunteering channels employees' professional expertise — marketing, finance, engineering, HR — into nonprofit projects that need those capabilities. The VQ Report 2026 identifies the shift from optional to expected as one of eight major trends. It deepens engagement, delivers measurable value to partner organizations, and helps employees see volunteering as career-relevant rather than a one-off event.
8. How does Micro-Volunteering support hybrid and remote workforces?
Micro-volunteering breaks projects into short, asynchronous tasks employees can complete in 15 to 60 minutes from any location. Formats include translation, mentoring emails, dataset review, and content creation for nonprofits. The VQ Report 2026 flags micro-volunteering and asynchronous formats as a defining 2026 trend, matching how hybrid teams already work and lowering the barrier to first-time participation.
9. Why are employees driving cause selection more than executives in 2026?
Workforces expect programs to reflect their own values, not a leadership-picked cause list. Employee-led selection improves participation, retention, and the authenticity of impact stories. The VQ Report 2026 identifies this shift as one of the year's defining trends, alongside standardized ESG reporting and platform consolidation. Companies increasingly run internal polls, ERG-led councils, or open nomination cycles to choose partners.
10. How can Goodera help scale Corporate Volunteering programs globally?
Goodera operates volunteering programs across 100+ countries with a curated network of vetted nonprofits, virtual and in-person formats, and reporting aligned to ESG frameworks. The platform handles employee sign-ups, event logistics, impact tracking, and consolidated dashboards. That combination lets global brands run consistent programs across geographies — one of the eight trends identified in the VQ Report 2026.